Tell-Tail · AI Activity
Available in Tell-Tail 0.5.0 and later. The AI Activity workspace combines supported local desktop observations, MCP server diagnostics, and opted-in Codex tool results. It does not read conversation databases or claim to observe every ChatGPT cloud operation.
See the implementation validation for measured limits, native migration evidence and live capture results.
One Tell-Tail, two workspaces
Use the Logs / AI Activity switch beside the Tell-Tail name. ChatGPT and
Codex identify this integration, not a separate product. /activity opens the
activity workspace; /logs opens the original metrics dashboard with aggregate
counts from the desktop logs already followed. No second follower is started.
The metrics are based on complete record contents and source-reported severity;
AI Activity applies its own event semantics. Ordinary warning-level connection
closures can therefore contribute to Logs warnings without becoming Problems.
Desktop Logs includes imported history at receipt time. Its byte counts exclude line endings, oversized records, partial records and unread bootstrap history; raw previews and unavailable ingestion diagnostics are hidden. The Activity Sources view retains follower/discovery diagnostics. General file/stdin launches keep their original physical-byte counters, parsers and recent-error previews. See workspaces for the full entry-point contract.
Start with Activity
cargo run --locked -- desktop --open
# Synthetic desktop events, connections, MCP failures and tool results:
cargo run --locked -- desktop --demo --open
# Finite metadata-only NDJSON inspection:
cargo run --locked -- desktop --once --output json
--open opens the default browser once at startup. --output web prints the
local URL without opening a browser. The login service does not open browser
windows at login or after crashes. The plugin opens the URL from tracing status
when you request the dashboard. The root page is Activity; Tools & MCP is
one destination within it. /mcp keeps the existing detailed MCP dashboard.
The independent tell-tail mcp command and APIs remain compatible.
On macOS, discovery uses the existing Codex Desktop log roots. Default discovery also includes supported Claude MCP logs; it does not implement a general Claude activity adapter. To select a specific source or directory:
Other platforms can use explicit directories containing supported log formats.
Files literally named desktop remain accessible as ./desktop or after --.
Headless text and JSON work without the web feature; the dashboard and receiver
require it. Demo and trace replay read no client logs and cannot enable an intake.
Find and inspect activity
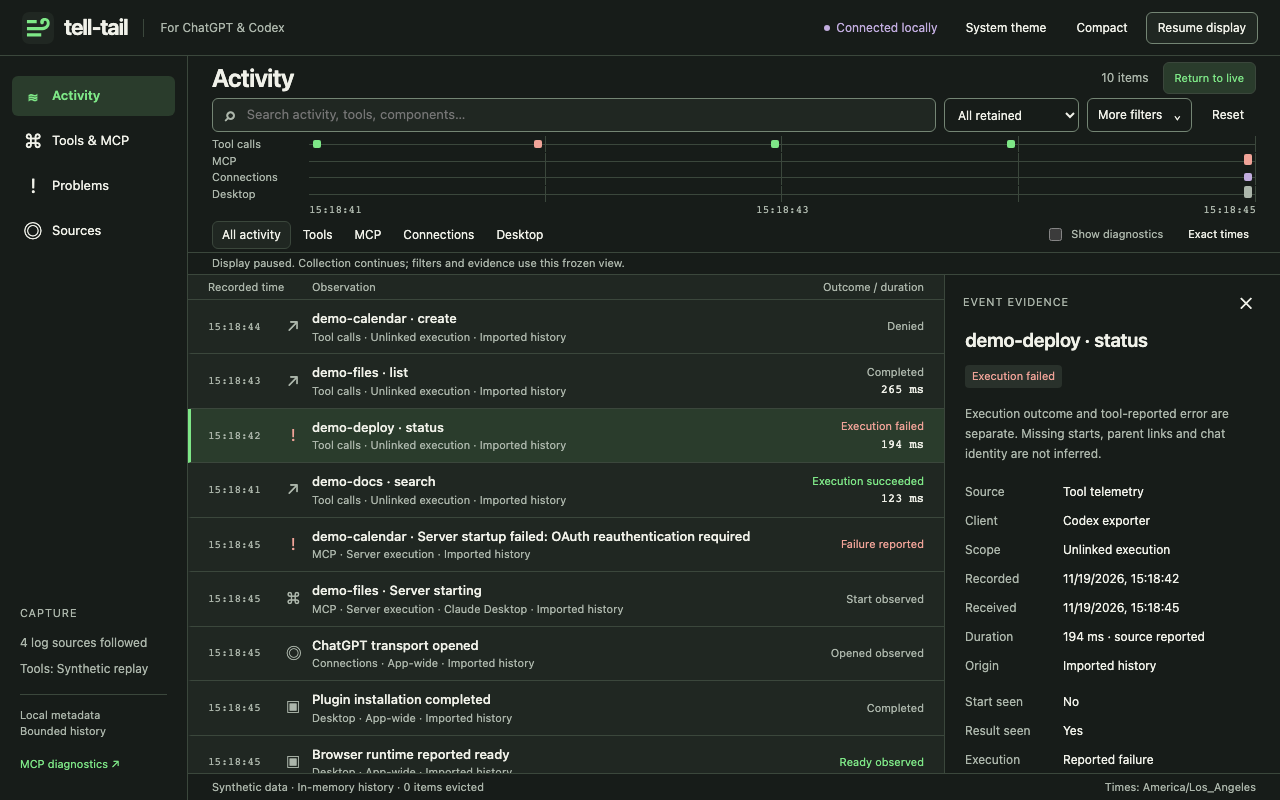
- Activity starts with compact rows and a four-lane time navigator. Recorded source time positions observations on the chart; the feed uses stable ingestion order. Missing source time remains unknown. Late arrivals are labeled.
- Tools & MCP focuses the same workspace on plugin results and server diagnostics. Provider suggestions come from observed tool namespaces, not an installed-plugin inventory. Searches cover all retained items, including pages beyond the first 100 rows.
- Problems groups reported failures by available verified execution scope. Unknown scopes stay separate. Recovery requires affirmative, matching MCP evidence; a normal closure, silence, or successful transport is not a failure or proof of application health.
- Sources explains followed files, exporter state, unsupported records, skipped history, collector limits, rejected input and retained evidence.
Select a row to inspect its outcome, timing, provenance, and safe diagnostic metadata. Linked evidence uses a shared local execution scope. Nearby in time compares recorded timestamps. When a result lacks a source timestamp, the feed labels its collector receipt time.
With local call inspection enabled, search for a chat title or operation. Select Show calls in this chat to filter by the matching execution identifier, even if two chats have the same title. Expand Show shell command or Show tool script for the submitted input. A reported shell exit code appears separately from the tool transport outcome. The collector reads names from the local Codex name index. It keeps unmatched calls accessible by their execution label. See the inspection settings and data limits.
Pause, inspection, keyboard focus on evidence, and scrolling into history hold a fixed view. Counts, filters, time bins, source status and details share its watermark while collection continues. Return to live explicitly updates it. Expired history and collector restarts are explained rather than silently substituting newer evidence. Connection status remains live while the display is paused. History is in memory and resets when the collector restarts.
The inspector sits beside the feed on wide screens and becomes a modal on narrow screens. Escape closes it and restores focus. Light, dark, system appearance, compact rows, reduced motion, and an Exact times table are supported. Only appearance preferences are saved in the browser; searches and evidence are not.
What the desktop adapter recognizes
desktop-log-v1 accepts an explicit component/event allowlist from the local
metadata audit. Unknown fields and raw message bodies are discarded before storage.
| Observations | Meaning and limits |
|---|---|
| Transport opened, closed, reconnect scheduled | App-wide connection observations; ordinary closure stays informational even when the log level is warning |
| Subscription established | Routine diagnostic; topic values discarded |
| Plugin installed, marketplace added/synchronized | Lifecycle observations; plugin identifiers and URLs discarded; no inferred installed inventory |
| Browser backend startup/ready | Separate observations; no invented attempt pairing or duration |
| Runtime dependency check started/finished | Separate runtime observations, not proof of all dependencies being healthy |
| Response routed | Routine diagnostic; allowlisted method and bounded reported duration; not model latency, tool execution, or chat state |
| Existing MCP events | Existing server lifecycle, failure, recovery and mirror handling retained |
| Codex OTLP tool results | Existing result-only capture and unknown-outcome semantics retained |
Routine diagnostics are hidden initially and can be included with Show diagnostics. The audited records came from this local ChatGPT/Codex Desktop installation. This is an adapter for observed log shapes, not a stable logging API or proof of support for every ChatGPT app version or surface. See the metadata audit and tool capture guide.
Persistent capture and migration
New tracing enable installations run the desktop collector. Existing owned
MCP installations migrate with the new executable's tracing upgrade:
The migration preserves the credential, ports and client configuration. It checks both receiver and activity health. Rollback restores the previous executable and launch command. Failed activation restores that generation automatically. Edited service definitions/exporters are preserved and refused. Disabled installations stay disabled. No Codex restart is needed when its loaded endpoint and credential remain unchanged. See lifecycle details.
Installing/updating a plugin alone does not silently replace the collector. This source implementation adds no beta package, version bump or publication.
Developer contract
One filesystem follower feeds the MCP parser and the desktop adapter. The
activity bridge projects sanitized MCP deltas and samples bounded accepted tool
revisions on collector ticks without holding both stores' locks together.
Intermediate tool revisions can coalesce; projection_gaps discloses coalesced
or missed revisions. There is no second unbounded event queue.
Activity has its own schema and epoch. /api/activity/snapshot returns a
watermark and source frame. Pass epoch and as_of to /items, /bins,
/problems, /sources, and /item/{id} under /api/activity. Item cursors bind
the watermark and filters; changing either invalidates the cursor. A restarted
collector or expired view returns HTTP 410. Unknown/duplicate/invalid query
parameters return 400. /events is SSE with coalesced watermark notifications,
not raw event payloads. Existing loopback Host/Origin and connection limits apply.
Supported filters: view, category, q, plugin, server, source, client,
scope, outcome, historical, since, until, diagnostics. Source timestamps
are milliseconds; since is inclusive and until exclusive. IDs, watermarks,
byte offsets and cumulative source counters use decimal strings. Time bins and
matched counts are bounded numeric values. Detail rows retain provenance and
qualified outcomes. NDJSON emits versioned activity_item, activity_sources
and explicit activity_gap envelopes.
Retention caps: 1,000 current items per category, 256 routine diagnostics, 8,000 revisions, 128 source frames, 4 KiB per normalized item, and a conservative 24 MiB activity-store charge. Existing MCP/trace stores have separate bounds. Shared bootstrap reads at most 2 MiB per file and 16 MiB total, across at most 64 followed files. Evictions can expire frozen views even when the selected item remains current. Pages contain at most 100 rows and 48 KiB of row data; failure group responses disclose omitted groups. Source frames are capped at 32 KiB. These are bounded local diagnostic views, not durable audit storage.
Run the Rust feature matrix and browser tests described in
dashboard validation. The finite
scripts/activity_benchmark.py exercises mixed input, bootstrap and burst load.
The two existing 24-hour soaks remain optional and non-blocking.